From data to decisions
How do you know if a new medical treatment works? Or whether access to green spaces makes people happier? Or whether hot weather makes people more prone to committing murder?
The answer is you look at data. Data can deliver incredible insights and help us to discern cause and effect.
The problem is that humans aren't great at analysing data. We're prone to see what we want to see and often spot patterns where there are none. This can lead to various forms of cognitive bias.
Cognitive bias
Our brains are optimised to make difficult decisions using the information available, often relying on shortcuts. However, this can lead to objective errors when making calculations and estimates. By defaulting to past experiences or emotions rather than careful reasoning, we risk multiple forms of bias that lead to mistakes. Find out more in this short introduction.
Even when we set out to analyse data objectively, hidden variables or a failure to look at the correct data can lead us to false conclusions. Confounder bias and selection bias are two common pitfalls.

Maths in a minute: Correlation versus causation
Confounder bias happens when you mistakingly assume that a correlation between two variables means that one causes the other, when in reality there is a third factor that causes them both. Find out more in this short introduction.
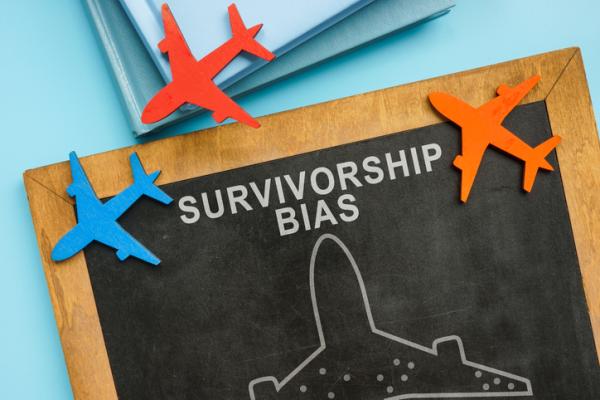
Maths in a minute: Selection (and survivorship) bias
Selection bias happens when you draw conclusions from a data set that doesn't represent the population you are interested in. An example is estimating the average height of the general population by looking at a basketball team. But there are less obvious examples too. Find out more in this short introduction.
In some situations you can avoid bias by performing experiments or studies under controlled conditions. The gold standard here are randomised controlled trials. These are often used to test new medical treatments.
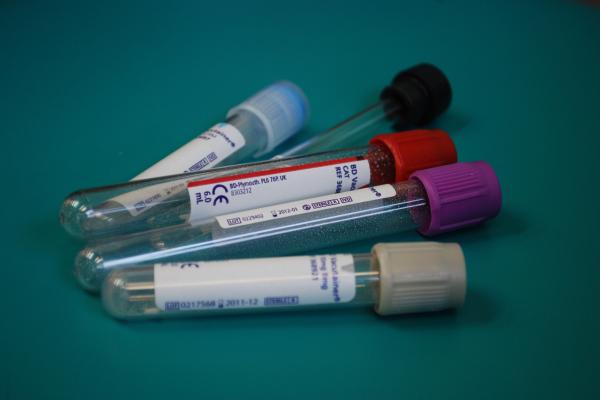
Maths in a minute: Randomised controlled trials
Randomised controlled trials are designed to minimise the chance of biases of various types. Using appropriate statistical techniques you can then see whether your data provides enough evidence to conclude that a medical treatment, or other intervention, actually works. Find out more in this brief introduction.

Maths in a minute: Hypothesis testing
One of these techniques is hypothesis testing. It helps you assess whether the data you observe indicate a causal link between variables, or are just a result of chance. Find out more in this brief introduction.
There are also situations, however, where controlled experiments are impossible and all we can do is observe people, and processes, in the wild. One helpful tool you can use in these cases is a DAG, short for directed acyclic graph.

The DAG behind the data
A DAG is akin to a cause-and-effect mind map. It helps you think through a situation in a systematic way. The patterns that show up in a graph indicate where you need to be careful when analysing your data to stop bias from creeping in. DAGs are useful, but also fun to think about. Find out more in this article.
We learnt about DAGs through a research programme at the Isaac Newton Institute for Mathematical Sciences, called Causal inference: From theory to practice and back again. Causal inference is a branch of statistics which seeks to draw credible conclusions about cause and effect from data even in situations that aren't straight-forward. In recent years the amount of data in the world has absolutely exploded, so causal influence is a fast-growing field. It's relevant in medicine and public health, the physical sciences, and the social sciences. Causal inference is also relevant to artificial intelligence which is all about learning from patterns in data.
The research programme brings together researchers and practitioners from all sorts of areas for seminars, workshops, and the opportunity to spend extended quality time exchanging ideas. Apart from developing the theory behind causal inference, participants of the programme also look at a broad range of application areas, from neuroscience to the law. An Open for Business event associated with the programme even featured a representative of Spotify, talking about how causal inference can help in promoting content to users.
One of the programme's participants is Eric Tchetgen Tchetgen, a statistician at University of Pennsylvania whose work focuses on public health. Here is a quick video featuring Tchetgen Tchetgen talking about his work and the programme.
To find out more about the programme, visit the Newton Institute website.
This content was produced as part of our collaboration with the Isaac Newton Institute for Mathematical Sciences (INI) and the Newton Gateway to Mathematics.
The INI is an international research centre and our neighbour here on the University of Cambridge's maths campus. The Newton Gateway is the impact initiative of the INI, which engages with users of mathematics. You can find all the content from the collaboration here.