Mind the data gap
Brief Summary
Researchers are calling for a more systematic approach to data collection when public services are disrupted. Without such data it is impossible to accurately understand or predict the intended and unintended consequences of these disruptions.
Sometimes, in the face of extreme health or weather events, normal life stops. Schools are shut. People have to stay at home. Work, even health care, might switch to online rather than in-person.
During such extreme situations these decisions might be made in order to keep people safe or to reduce the spread of a disease. In a crisis the information on exactly how these public services are disrupted, and when they stop, isn't always recorded. Without this information we can never know what impact these massive interventions made, both the intended and unintended consequences. And we can't learn from these past interventions or disruptions in order to make better informed decisions in the future.
Collecting data and connecting people
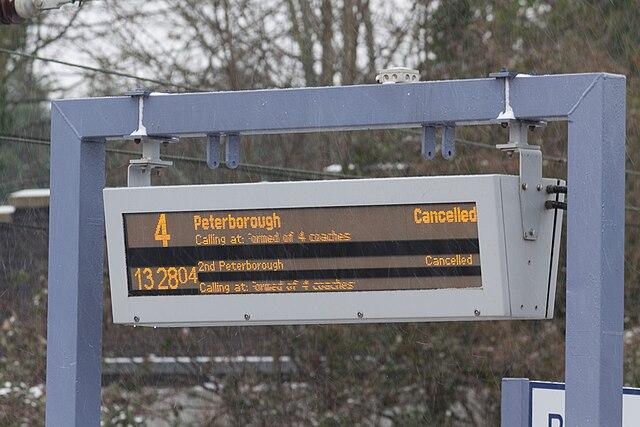
This might bring to mind the restrictions of the COVID pandemic, but this wasn't the first time schools and other services have been interrupted. Schools closed to slow down the H1N1 outbreaks in the USA in 2019 but it is very difficult to find out the details of exactly when each school shut, says Sangeeta Bhatia, an infectious disease modeller from Imperial College London. Trains were cancelled and passengers were warned not to travel during a heatwave in England in 2022. But data on the closures and interruptions of these public services is not collected in a systematic way.
"We can't measure the impact of these interventions if we don't know what is closed and when," says Sangeeta. "A critical piece of information is missing." In response Sangeeta and her colleagues organised a workshop in June 2025 to discuss how this data can be collected and used to make better decisions in the face of future crises. The M5 workshop – Modifications Matter: Mapping, Measuring, and Modelling Public Service Changes and Disruptions – brought together a wide range of expertise. Along with infectious disease modellers, such as Sangeeta, there were also social scientists, data collection experts, experts from the World Health Organisation with experience in humanitarian responses, and scientists studying the impact of climate change on public health.
"The highlight of the workshop was bringing this different expertise together, it was exciting to hear these different perspectives and voices," says Sangeeta. For example, Anna Petherick, a social scientist from the University of Oxford, led the Oxford COVID-19 Government Response Tracker (OxCGRT). This project brought together a huge amount of data, often not originally collected for public health purposes, that proved to be a vital resource for many researchers during the pandemic, including infectious disease modellers. This new approach for data collection is one of the outcomes of the OxCGRT that could be used in many fields. Sangeeta says that having such different perspectives at the workshop, from social and political science, provided a new way of thinking about data collection to disease modellers like herself.
Planning for the future
The workshop flagged up many important next steps, many of which are highlighted in an upcoming paper produced by many of the participants in the workshop. This frames several calls for action, including the need for investment into broad base data collection projects like the OxCGRT, raising the awareness of the need for this data into planning and policy, and building capacity and infrastructure for collecting and using such data in a crisis.
Participants from the UK Health and Security Agency (UKHSA) noted that this is now a high priority, both for understanding the planned impact of an intervention, but also in order to quantify the unintended consequences. "Even small steps have short, and long consequences, such as the loss of learning when closing schools," says Sangeeta. "Collecting this data is important for a lot of different actors responsible for public services."
Modelling
A mathematical model is a description of a process in the world around us in terms of mathematical expressions. You can use the model to get an idea of how the process may play out, or how this might change if circumstances change. For example, an infectious disease model describes how some factors affect the spread of a disease.
You can find out more, including how models are used, here.
Sangeeta's own research now focuses on whole system modelling, which aims to understand the whole ecosystem of health care. She works on the Thanzi La Onse (TLO) Model that aims to understand the Malawi health system from an epidemiological and an economic perspective: "all the hospitals, all the healthcare systems, the characteristics of the population, and looking at this for multiple diseases." By describing this complex system using mathematical models, Sangeeta and her colleagues help policy makers make better informed decisions on critical questions about health systems. She hopes that by drawing attention to the gaps in data on public services modifications, they can help establish similar pipelines that can generate robust evidence next time public services are disrupted in the face of a health crisis.
About this Article:
Sangeeta Bhatia is a research fellow at Imperial College London and an Affiliate member of JUNIPER, the Joint UNIversities Pandemic and Epidemiological Research network.
Rachel Thomas is Editor of Plus.
This article is part of our collaboration with JUNIPER, the Joint UNIversities Pandemic and Epidemiological Research network. JUNIPER is a collaborative network of researchers from across the UK who work at the interface between mathematical modelling, infectious disease control and public health policy. You can see more content produced with JUNIPER here.